
Infographics are one of the most powerful ways to communicate data, ideas, and stories visually. Whether you’re a marketer, teacher, student, business owner, or content creator—infographics help simplify complex information into engaging and easy-to-understand visuals.
In 2025, infographic tools have become smarter, AI-powered, and easier to use than ever. You no longer need advanced design skills to create stunning infographics. With ready-made templates and drag-and-drop editors, anyone can design professional visuals in minutes.
To make your choice easier, we’ve compiled the Best Infographic Maker Tools for 2025 — including free, paid, and AI-powered options.

Why Use Infographic Maker Tools?
Infographics are popular because they:
Increase engagement
People share visual content 2x more on social media.
Improve learning
Students & professionals understand visual data faster.
Boost traffic for blogs
Infographics attract backlinks & improve SEO.
Save time
Ready templates help you design faster.
Build brand authority
Eye-catching graphics make your content look premium.
Best Infographic Maker Tools (2025)
1. Visme – Best Overall Infographic Maker (2025 Winner)
Visme is one of the most advanced infographic tools available. It’s perfect for businesses, marketers, educators, and teams who want professional-quality visuals.
Key Features
- 1000+ infographic templates
- Data widgets & charts
- AI Presentation & Infographic Builder
- Brand Kit (colors, fonts, logo)
- Animation & interactivity
- Graphs, maps & analytics
Pros
- Best for business-grade infographics
- Advanced data visualization
- Amazing animations
- AI design assistance
Cons
✘ Free version is limited
✘ Slightly complex for total beginners
Best For: Businesses, agencies, teachers, marketers
Official Website: https://www.visme.co/
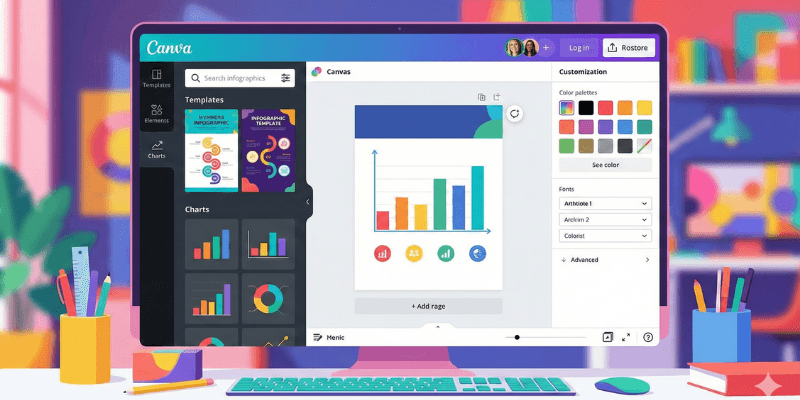
2. Canva – Best for Beginners & Quick Infographics
Canva offers one of the easiest infographic editors with thousands of drag-and-drop templates.
Key Features
- 5,000+ infographic templates
- AI Magic Design
- Charts & icons
- Drag-and-drop editor
- Stock photos + illustrations
Pros
- Easiest tool for beginners
- Best for students & creators
- Millions of design assets
- Works on mobile & desktop
Cons
✘ Some assets need Canva Pro
✘ Data visualization is simpler than Visme
Best For: Students, bloggers, small businesses
Official Website: https://www.canva.com/
3. Piktochart – Best for Data-Heavy Infographics
Piktochart specializes in data visualization. It’s great for journalists, researchers, and storytellers.
Key Features
- Detailed charts
- Business infographics
- Report & poster templates
- Team collaboration
Pros
- Perfect for research data
- Clean, minimal designs
- Easy for non-designers
Cons
✘ Free plan limited
✘ Fewer templates than Canva
Best For: Researchers, corporate teams
Official Website: https://piktochart.com/
5. Venngage – Best for Business & Marketing Infographics
Venngage focuses on creating stylish business infographics optimized for branding and storytelling.
Key Features
- Business infographics
- SWOT, timeline, process templates
- Branding Kit
- Collaboration features
Pros
- Great business layouts
- Strong customization
- Good for teamwork
Cons
✘ Watermark in free version
✘ Costs more than Canva
Best For: Marketers, teams, educators
Official Website: https://venngage.com/
5. Adobe Express – Best for Premium Adobe Designs
Adobe Express is Adobe’s simplified design platform with clean templates and Firefly AI integrated.
Key Features
- Templates from Adobe designers
- Firefly AI graphics
- Instant resize
- Chart integration
- Premium fonts
Pros
✔ Very professional look
✔ Strong AI tools
✔ Works seamlessly with Adobe apps
Cons
✘ Full features require subscription
Best For: Designers, Adobe users
Official Website: https://www.adobe.com/express/
6. Infogram – Best for Interactive Data Visualizations
Infogram is perfect for interactive infographics, dashboards, and data-driven graphics.
Key Features
- Interactive charts
- Maps & graphs
- Embeddable infographics
- Real-time data updates
Pros
- Best for dashboards
- Great for big data visuals
Cons
✘ Not for simple designs
✘ Expensive for teams
Best For: Analysts, finance teams
Official Website: https://infogram.com/
7. Easel.ly – Best for Simple Educational Infographics
Easel.ly is a basic infographic maker used mostly by educators and students.
Key Features
- Simple templates
- Classroom themes
- Easy drag-and-drop
Pros
- Beginner-friendly
- Very affordable
Cons
✘ Limited designs
✘ Not suitable for business branding
Best For: Students, teachers
Official Website: https://www.easel.ly/
Comparison Table (2025)
| Tool | Best For | AI Tools | Free Plan | Difficulty |
|---|---|---|---|---|
| Visme | Business infographics | Yes | Limited | Medium |
| Canva | Beginners | Yes | ✔ | Very Easy |
| Piktochart | Data visualization | No | Limited | Easy |
| Venngage | Marketing & business | Yes | Limited | Medium |
| Adobe Express | Designers | Yes (Firefly) | Limited | Medium |
| Infogram | Interactive data | Limited | Limited | Hard |
| Easel.ly | Students | No | ✔ | Very Easy |
Which Infographic Tool Should You Choose?
- Best overall → Visme
- Best for beginners → Canva
- Best for data-heavy infographics → Piktochart
- Best for marketing & business → Venngage
- Best for Adobe users → Adobe Express
- Best interactive dashboards → Infogram
- Best for students → Easel.ly
🧭 Final Verdict
Infographics remain one of the most effective ways to communicate information visually. Whether you’re presenting data, creating social media content, teaching students, or pitching ideas—these platforms make infographic creation faster and more professional.
The best combination for 2025 is:
👉 Visme + Canva + Piktochart
Together, they cover business needs, beginner use, and data visualization.